
Toilet Paper
I’m hearing a lot of people providing forgone conclusions about interest rate pressures and the effect on the economy and markets. As always, we have to disentangle facts from conjecture, strip out the noise, and then figure out how today’s financial climate impacts you personally.
Disentangling facts from conjecture….
On Wednesday, May 4, the Federal Reserve increased the target federal funds rate by 50 basis points (0.50%) as part of their effort to combat inflation.
Understandably, interest rate hikes cause investors to worry that stock market returns can’t keep up because companies can’t finance growth with cheap loans and consumers can’t buy the stuff companies sell with relatively inexpensive credit. Further, higher rates often means higher yields on savings accounts, CDs, etc., which encourages saving instead of spending.
Private sector investment and consumer spending are the linchpins to the US economy so, like I said, the worries are understandable.
However, the market can surprise us (as the market seems to do often) and history offers good news: stock market returns in the US have been positive on average following hikes in the fed funds rate.
(past performance is not a guarantee of future performance)
Dimensional studied the relation between US equity returns, measured by the Fama/French Total US Market Research Index, and changes in the federal funds target rate from 1983 to 2021. Over this period of 468 months, rates increased in 70 months and decreased in 67 months. The chart below presents the average monthly returns of US stocks in months when there is an increase, decrease, or no change in the target rate.
On average, US equity market returns are reliably positive in months with increases in target rates. Moreover, the average stock market return in those months is similar to the average return in months with decreases or no changes in target rates…. It’s almost like you shouldn’t aim to build your investment philosophy around short term market responses to Federal Reserve actions.

The chart above highlights the rate of US stock returns in the month of a rate hike, but what about the months after rate hikes?
The chart below presents annualized US equity market returns over the one-, three-, and five-year periods following one or two consecutive monthly increases in the fed funds target rate, as well as following months with no increase. In reassuring news for investors concerned with the current environment of multiple scheduled rate increases, the US stock market has delivered strong longer-term performance on average regardless of activity at the Fed.

As I’ve mentioned before, market participants (i.e. me, you, and everyone else) are guessing what is going to happen in the future and using their capital today to inform that vision of what’s to come. This is why the bond market is on pace for it’s worst year ever despite there only being 0.75% of rate hikes thus far — there’s an expectation things will happen and that’s already reflected. This is also why stocks are falling despite mostly solid earnings — again, an expectation. Heck, it’s also why people made a run for toilet paper in 2020 when they expected a future shortage and then ended up causing a shortage sooner than it would have naturally occurred, if at all…(finally you now know why the blog is called “Toilet Paper”… had to keep your attention for a little bit.)
The gist of it is this: it’s all noise. CNBC, The Fed, Your Uncle Bill Who Only Owns Berkshire Hathaway, Me & Harding Wealth, The Voice In Your Head Telling You To Buy Or Sell, etc…. Noise.
Tune it out.
Zoom out.
You’re built for this…we’re built for this.
When you see big bold RED numbers on the computer or TV screen, that means a bunch of people are selling investments — but who is buying them on the other side of that trade? Are they a foolish person? Maybe. Or perhaps they’re just better at turning off the notifications on their phone or asking themselves “What would I tell myself 10 years from now?”
With that I will leave you with one final graphic and comment.
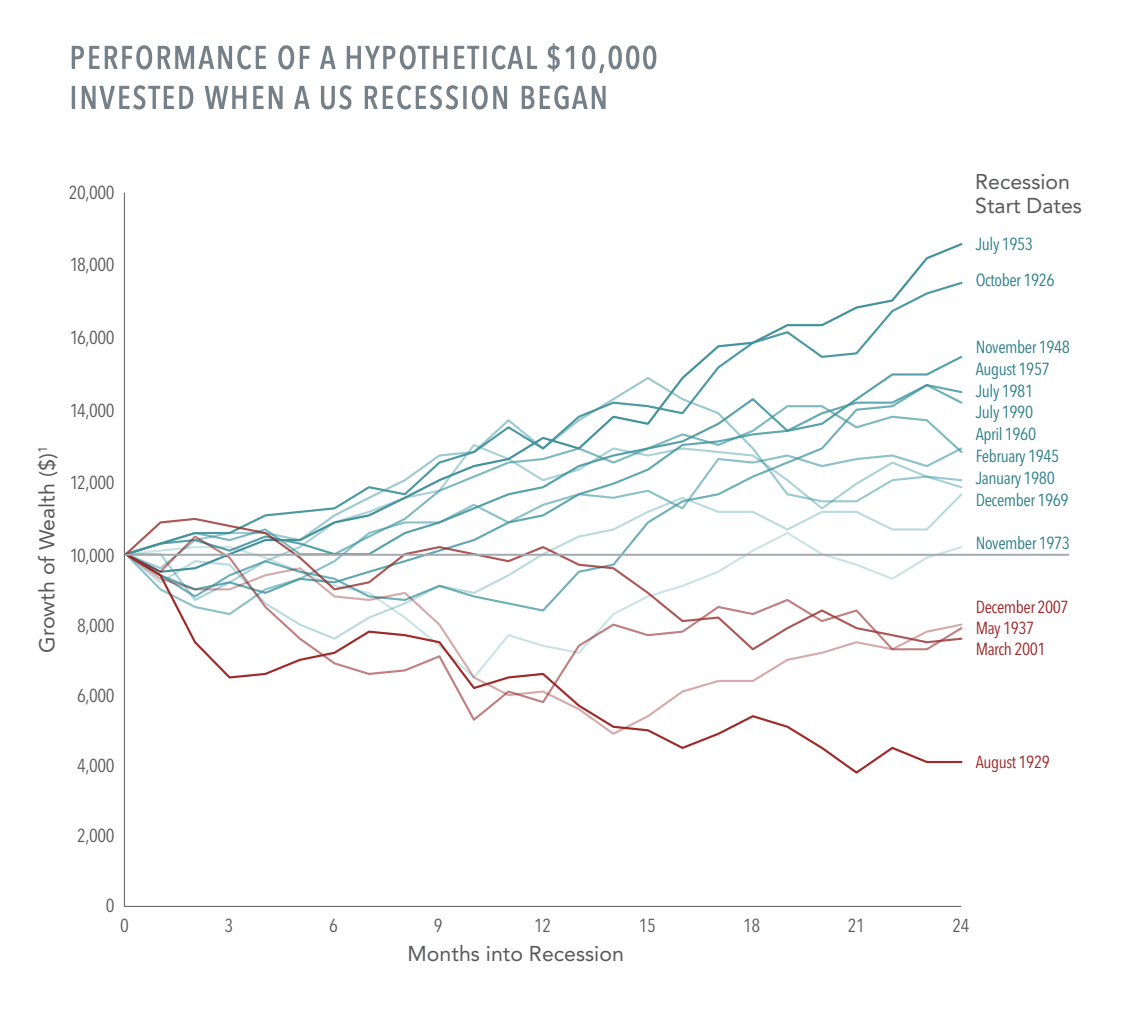
The recession fears are palpable right now as it’s nearly a forgone conclusion that we’ll see a decline in economic performance — don’t immediately assume that’s a bad thing for stocks. We can talk more about recessions in a future blog, but here’s the stock market performance of a hypothetical $10,000 investment from the beginning of every recession of the last century through the following 24 months.
In many cases, by the time the recession arrives, the drop has already occurred — again, beware the noise and remember the toilet paper shortage.
That’s all for now.
Onward,
Adam Harding | Founder @ Harding Wealth | Advisor | Optimist |
www.hardingwealth.com
*Thanks to Dimensional Fund Advisors for the data analysis.
DISCLOSURESThe information in this material is intended for the recipient’s background information and use only. It is provided in good faith and without any warranty or representation as to accuracy or completeness. Information and opinions presented in this material have been obtained or derived from sources believed to be reliable and we have reasonable grounds to believe that all factual information herein is true as at the date of this material. It does not constitute investment advice, recommendation, or an offer of any services or products for sale and is not intended to provide a sufficient basis on which to make an investment decision. It is the responsibility of any persons wishing to make a purchase to inform themselves of and observe all applicable laws and regulations. Unauthorised reproduction or transmitting of this material is strictly prohibited. We accepts no responsibility for loss arising from the use of the information contained herein.RISKS
Investments involve risks. The investment return and principal value of an investment may fluctuate so that an investor’s shares, when redeemed, may be worth more or less than their original value. Past performance is not a guarantee of future results. There is no guarantee strategies will be successful.