
A Year.
Confetti poppers have been popped.
Champagne has been toasted and resolutions made.
The ball has been dropped in Times Square and, perhaps more famously, the Giant Potato lowered in my hometown of Boise, ID.
See for yourself:

Nothing should truly be different in our lives after the great potato’s descent — but when we turn the calendar over investors tend to wipe the slate clean and start fresh when they consider performance, their net worth, and their objectives.
In practice, we know what matters is the combination of days and months and years.
In light of that, here are some comments on 2023 and that combination of years:
1) First, how did markets end in 2023?
The US Stock markets performed nicely last year (The S&P 500, Dow Jones Industrial Average, & Nasdaq).
International (MSCI EAFE) and Emerging Markets (MSCI Emerging Markets) stocks were positive despite worrisome regional geopolitical factors (notably, Isreal/Gaza and Ukraine/Russia).
Real estate climbed nearly 8% (Dow Jones US Real Estate Index) and the bond market (Bloomberg US Aggregate) eked out a 5% climb.
Here’s the chart:

Wow, look at that purple line (the tech-heavy Nasdaq index)!
In a perfect world you’d be able to buy tech stocks in 2023 while having avoided them in 2022 and then pivot out of them before they come due their next big drop, whenever that may be. Unfortunately, things don’t work that way and market timing is a seductive but elusive pipe dream.
So, let’s look at a little longer timeframe…
2) Paired Experiences.
Here’s one of my favorite math equations:
101% ^ 365 days = 37.8x
(please don’t tell 14 year old me that I have favorite math equations later in life)
This math basically says, if you improve something by 1% every day (100% plus 1% = 101%) you’ll be 37.8x better at the end of a year (365 days).
Compare this to 100% ^ 365 = 1; which means you end with what you started with, and you can start to realize the importance of small incremental gains strung together. The combined experience is what matters… This is how compounding works.
But prior experiences aren’t always gains.
Does anyone remember 2022? You know, the worst year EVER for the bond market and third worst year for a 60/40 stock & bond portfolio?
While the numbers for 2023 look great, we have to remember 2022 and the combination of paired experiences. Here’s an example of why this matters:
…Let’s say you got a 100% return this year. ONE HUNDRED. Congrats.
…Oh yea, but last year you lost 50%.
That’s okay, let’s look at your average rate of return:
Year 1 -50%
+ Year 2 100%
= 50%
Divide 50% by 2 years and you get 25% per year. Not bad, right?
Wrong.
If you started with $1m and lost half of it (-50%) you’re left with $500k. Then the $500k gets a 100% return and you’re back to $1m where you started. Your return is 0%.
So, let’s consider 2022 & 2023 together:

It’s worth pointing out the 2 year Nasdaq performance.
In 2022 it was negative 33%.
In 2023 it was positive 43%.
Traditional arithmetic would have us adding those two numbers together and dividing by 2 to get the average return for the last two years:
-33% + 43% = 10%
10% / 2 = 5% per year.
In reality, for an investment to get back to even after a 33% decline, the subsequent return needed is 50%. This is why the chart above shows the Nasdaq index at negative 4% even after rallying 43% in 2023.
While the 13.7% return for the Dow Jones Industrial Average in 2023 might be less exciting than the high flying, tech heavy Nasdaq index, the fact that the decline was only 8.7% in 2022 means it’s been the best performing major index over these two years at positive 3.7%.
The lesson: be wary of volatile investments, huge drops are hard to recover from.
3) Big Stocks and the Challenges of Stockpicking
The S&P 500 index is the most widely referenced indicator of US Stock Market performance. In 2023 it covered 503 companies (not 500, as one would think). Here are some facts about those companies:
323 out of 503 had a positive 2023 return, 180 were negative.
148 companies did better than the index average (24.2%), 355 did worse.
The S&P 500 is a cap-weighted index, meaning the bigger the company is, the more it can influence performance. In 2023, several big companies had great returns, including Nvidia (+238%), Meta (+194%), and Tesla (+101%), to name a few. If you were trying to build a portfolio of individual stocks and missed out on some of these big winners, it would have been hard to keep up with the index.
That last point is worth a bit more exploration…
You may have encountered a new term this year, The Magnificent 7, which refers to Alphabet, Amazon, Apple, Meta Platforms, Microsoft, NVIDIA, and Tesla.
These stocks continue to capture the focus of investors as they’ve outpaced the bulk of global equities. Their outperformance is notable because eye-popping returns for top stocks tend to occur before they reach the top of the market. Seems reasonable, right? Grow fast on the way up, then stagnate.
We don’t know what will become of these stocks, but we can certainly look to history when it comes to stocks becoming the largest and the events before and after. Here’s a chart from Dimensional which highlights some valuable perspective on this:
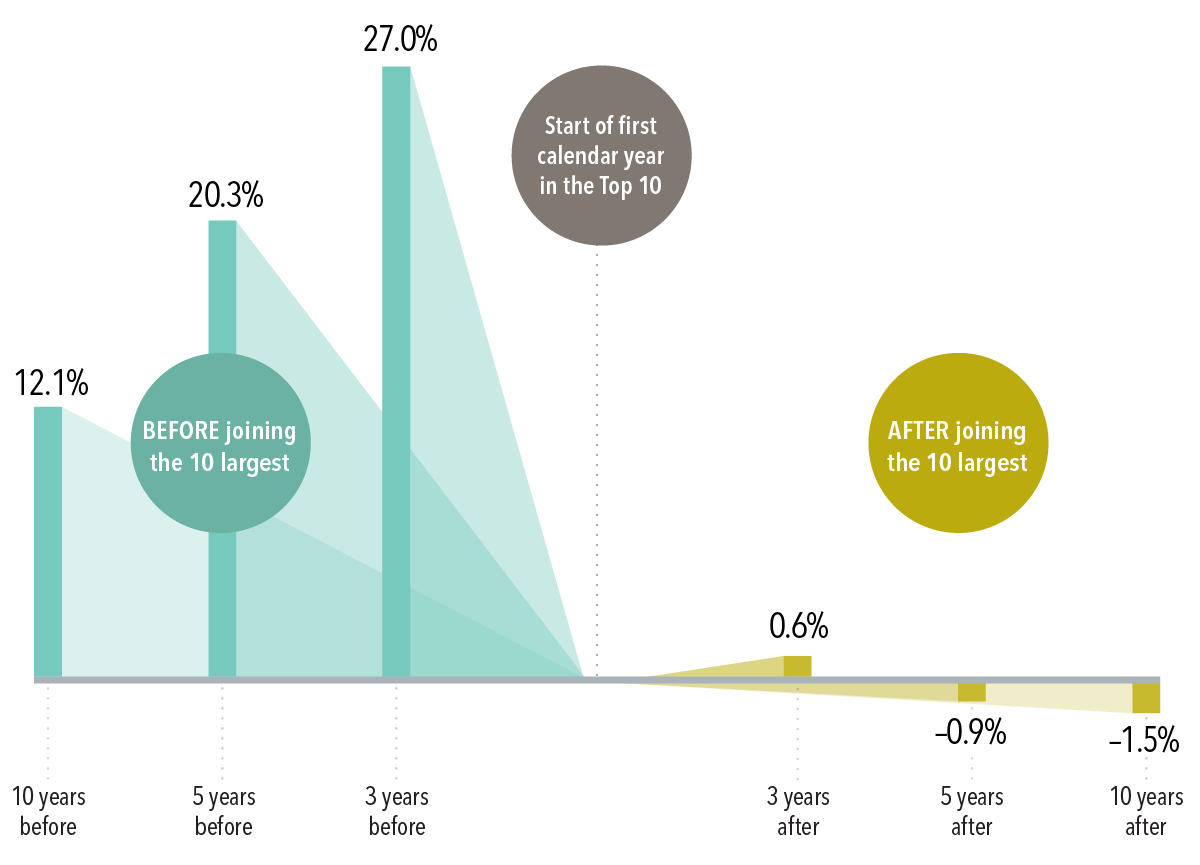
While things certainly could end up being different this time, the above is a cautionary tale for those expecting continued outperformance from the Magnificent 7.
In fact, rather than seeking additional exposure to these mega cap stocks, I believe investors should ensure their portfolios are broadly diversified to capture the returns of whatever companies ascend to the top in the future.
4) Perspective
How we segment information is important. It helps us focus and what gets focused on gets improved.
I mentioned earlier that a year doesn’t matter much, and that’s kind of true when considering an overall investment experience. However, when we segment the information differently it becomes easy to see how much a year matters.
Exhibit A:

There aren’t many squares in that image, are there?
…A little less than two handfuls of decades total, if you’re lucky.
…Two or three rows of retirement if you do it right.
…One, maybe one and half rows of having young kids.
When we look at it like this, a year is everything. Since this is the time of year for resolutions and goal-setting, let’s be sure your focus with money is aligned with making the most of the year — of your time.
As investors, let’s go into the new year thinking:
Does my saving, spending, and investment behavior align with what I’ve stated as my purpose with money?
How does recent performance impact my approach going forward?
Am I diversified across different asset classes?
Am I over-exposed to any individual stocks?
Answer those 4 questions and you’ve got a solid base for another year. Clients, let’s revisit these questions in our annual review (Schedule here, give me a call, or reply to this email).
Until next time,
Adam Harding
Advisor & Owner at Harding Wealth
www.hardingwealth.com
Oh yea, one more thing:
2024 is bound to be another year with captivating news… much of which may be negative (elections, wars, etc.).
Here’s my personal New Year’s Resolution which I think will help deal with this environment:
Find the most local newspaper I can. Maybe it’s the publication of my city, neighborhood, kids’ school, etc..
Start there and look for bad news (spoiler: it will be a lot harder than national coverage). If I do find bad news there’s a much better potential for me to personally impact and improve the situation in my backyard than if the bad news were across the country or over an ocean.
Then think to myself, if someone were writing a newspaper about my friends, family, and colleagues, what would the headlines say?
In 2024 I want these headlines to receive my attention.
That’s all for now, Happy New Year everyone. AH
*Past performance not indicative of future results. You cannot invest directly in an index. For educational purposes only.